11 • Visual AnalyticsCommercial & Integration Suite
Interactive Reporting and Power BI
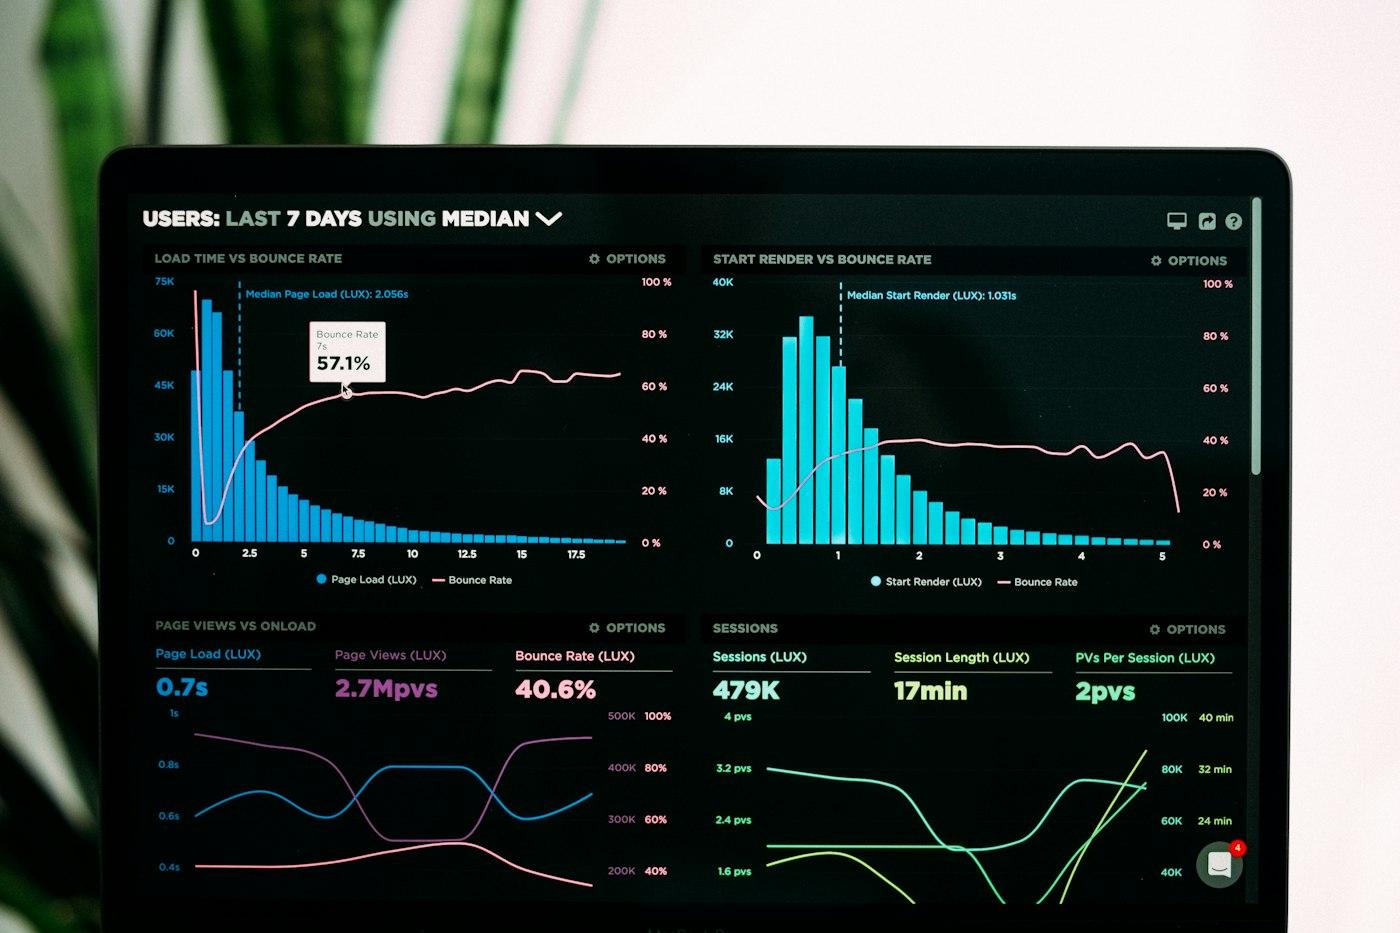
Interactive Power BI dashboards, automated reporting workflows, and visual performance analytics across schedule, cost, and risk.
Capability Overview & Advisory Scope
Logic Pulse builds custom Microsoft Power BI executive and project suites that ingest Primavera P6, EcoSys/ERP, risk, and variation datasets—giving sponsors and delivery teams live drill-down analytics across cost, schedule, and commercial performance.
Key Deliverables
- Custom Microsoft Power BI executive & project dashboards
- Automated DAX data models & reporting workflows
- CPI, SPI, critical path & variation trend visualisations
- Role-tailored views for delivery teams & steering committees
Early Warning Indicators
- Static PDF packs that cannot answer executive questions during steering reviews
- Days lost each month manually formatting charts across multiple workstreams
- Hidden package-level cost or schedule slippage masked by portfolio averages
Commercial & Controls Mechanism
We architect relational star-schema data models with automated ETL pipelines and DAX measures, enabling one-click filtering from portfolio level down to individual work packages.
Outcome Impact
Replaces manual slide compilation with live drill-down visibility into schedule and cost exceptions.